A/B Testing Pinterest Pins: Make Your Audience Click Like Crazy
A/B testing is a useful method for optimizing your Pinterest growth and marketing efforts by comparing different versions of your pins. It’s a process of systematically testing and refining various elements of your pins, such as design, text, and call-to-action, you can gain valuable insights into what resonates most with your audience.
In this article, we will describe the detailed steps of conducting A/B tests on Pinterest, so you can improve your pins’ visibility, engagement, and overall effectiveness.
How to A/B Test Your Pins
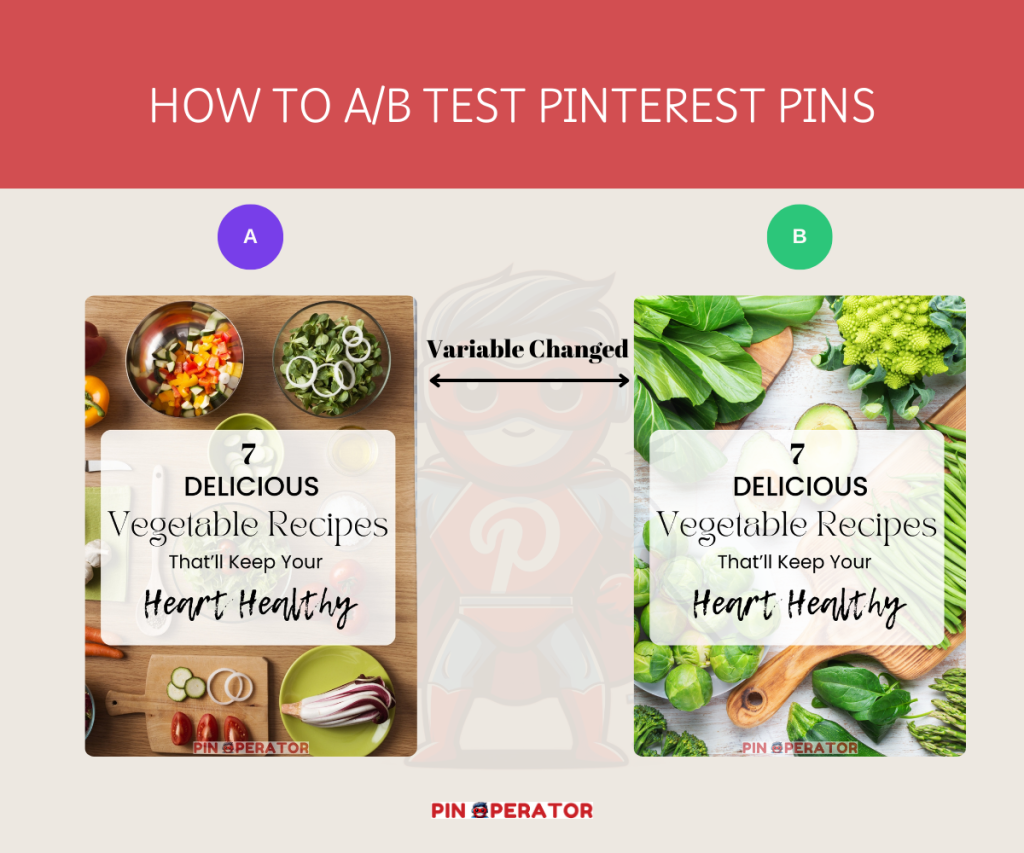
The goal for Pinterest A/B testing is achieving the best possible result for your Pinterest account by increasing your pin’s click-through rates and engagement (total pin clicks, saves).
Having a well-defined goal will help you decide which elements need to be changed and accurately measure your test’s success.
Here is the process of A/B split testing your pins:
1. Choose Variables to Test
Select one specific variable to test at a time. This approach ensures that you can attribute any differences in performance directly to the variable you changed. Common variables to test include:
- Pin Design: Test different images, color schemes, and layouts.
- Text: Experiment with different headlines, descriptions, and body text.
- Call to Action (CTA): Try various CTAs to see which ones encourage more clicks or engagement.
- Pin Format: Compare the performance of different pin formats, such as standard pins, video pins, and carousel pins.
Design two or more versions of the pin, ensuring only the selected variable changes.
For instance, if you’re testing the image title, ensure the images, colors, and layout remain the same across all variations. This control ensures that any differences in performance metrics are due to the title change.
To avoid any time-of-day or day-of-week biases that could affect the results, publish the pin variations on the same day of the week and pin them to the same board
2. Run the Test
Allow the test to run for a sufficient period to gather meaningful data. The duration of the test will depend on your usual engagement rates and how quickly you can collect significant data. Typically, a testing period of one to two weeks is adequate, but you may need longer if you have a smaller audience.
Track key performance metrics such as impressions, saves, click-through rates, and overall engagement. Use Pinterest Analytics to collect this data. Third-party analytics tools such as GA4 can also provide additional insights and help you track performance more comprehensively.
3. Analyze Results
Once the test period is over, analyze the performance of each pin variation. Compare the results based on your initial goals. For example, if your goal was to increase click-through rates, look at which pin variation had the highest click-through rate and analyze why it performed better.
Based on your analysis, implement the insights gained from the test. For example, if you found that a specific headline increased engagement significantly, use similar headlines in your future pins. Continuously apply these learnings to optimize your Pinterest strategy.
4. Document and Iterate
Keep a detailed record of your A/B tests, including the variations tested, the results, and any insights gained. Regularly review and refine your approach based on accumulated data. A/B testing should be an ongoing process as audience preferences and platform algorithms can change over time.
By following these steps, you can systematically test and improve your Pinterest pins, enhancing your overall performance and achieving your marketing goals more effectively.
Key Pin Metrics for A/B Testing
Pinterest analytics shows different metrics for overall and individual pins. Some of these metrics are highly useful for evaluating your pin design and strategy, so you need to clearly understand what these pin metrics indicate.
Overall Performance Stats
Impressions, engagements, and outbound clicks are the key overall performance metrics to evaluate your overall pin designs.
Let’s take a look at the screenshot of the 30-day overall performance metrics of a Pinterest account managed by us in the fashion and beauty niche.
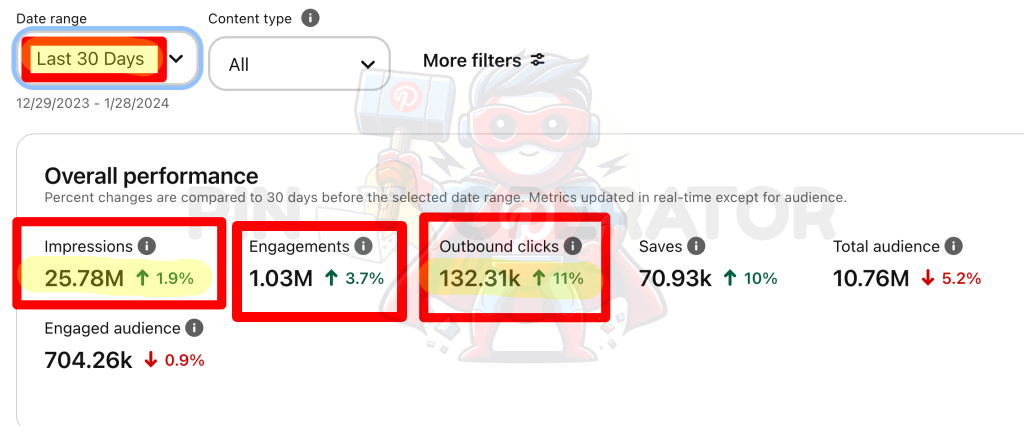
What do these performance metrics mean?
Impressions
Impressions are the number of times your pins showed up on the screen. The number shows that all pins on this account appeared 25,78 * 10^6 times on the screen in 30 days.
However, high impressions are less related to good pin designs. Because even if someone scrolls past your pin without noticing, it still counts as an impression. It only indicates that your Pinterest account is optimized and keywords and there are no issues like the Pinterest spam filter limiting your account’s reach.
Engagements
Engagements show all interactions with your Pins, such as saves, Pin clicks, and outbound clicks. While engagements don’t guarantee conversion, the engagement rate indicates your pins are getting attention.
You can calculate the engagement rate using this formula: (Engagements / Impressions) * 100
So, the engagement rate of the account is {(1.03 * 10^6) / (25.78 * 10^6)} * 100 = 3.99%
Outbound Clicks
Outbound clicks represent the number of times users visit the destination URL associated with pins, usually leading them outside of Pinterest to your website.
It means people not only find your pin attractive enough to click and open but also become interested enough to learn more about it, which is the ultimate goal of posting a pin. That’s why outbound click rates are called the conversion rate or CTR.
You can calculate your CTR using this formula: (Outbound clicks / Impressions) * 100
So, the conversion rate of the account is {(132.31 * 10^3) / (25.78 * 10^6)} * 100 = 0.51%
Now let’s move on to individual pin stats.
Individual Pin Stats
Evaluating individual pin performance is crucial for A/B testing your pin design. Click on any of your pins to see a quick overview at the top. Then, click on “See more stats” to check the outbound clicks from the pin.
Here is a screenshot of the 30-day stats of a pin on men’s fade haircuts:
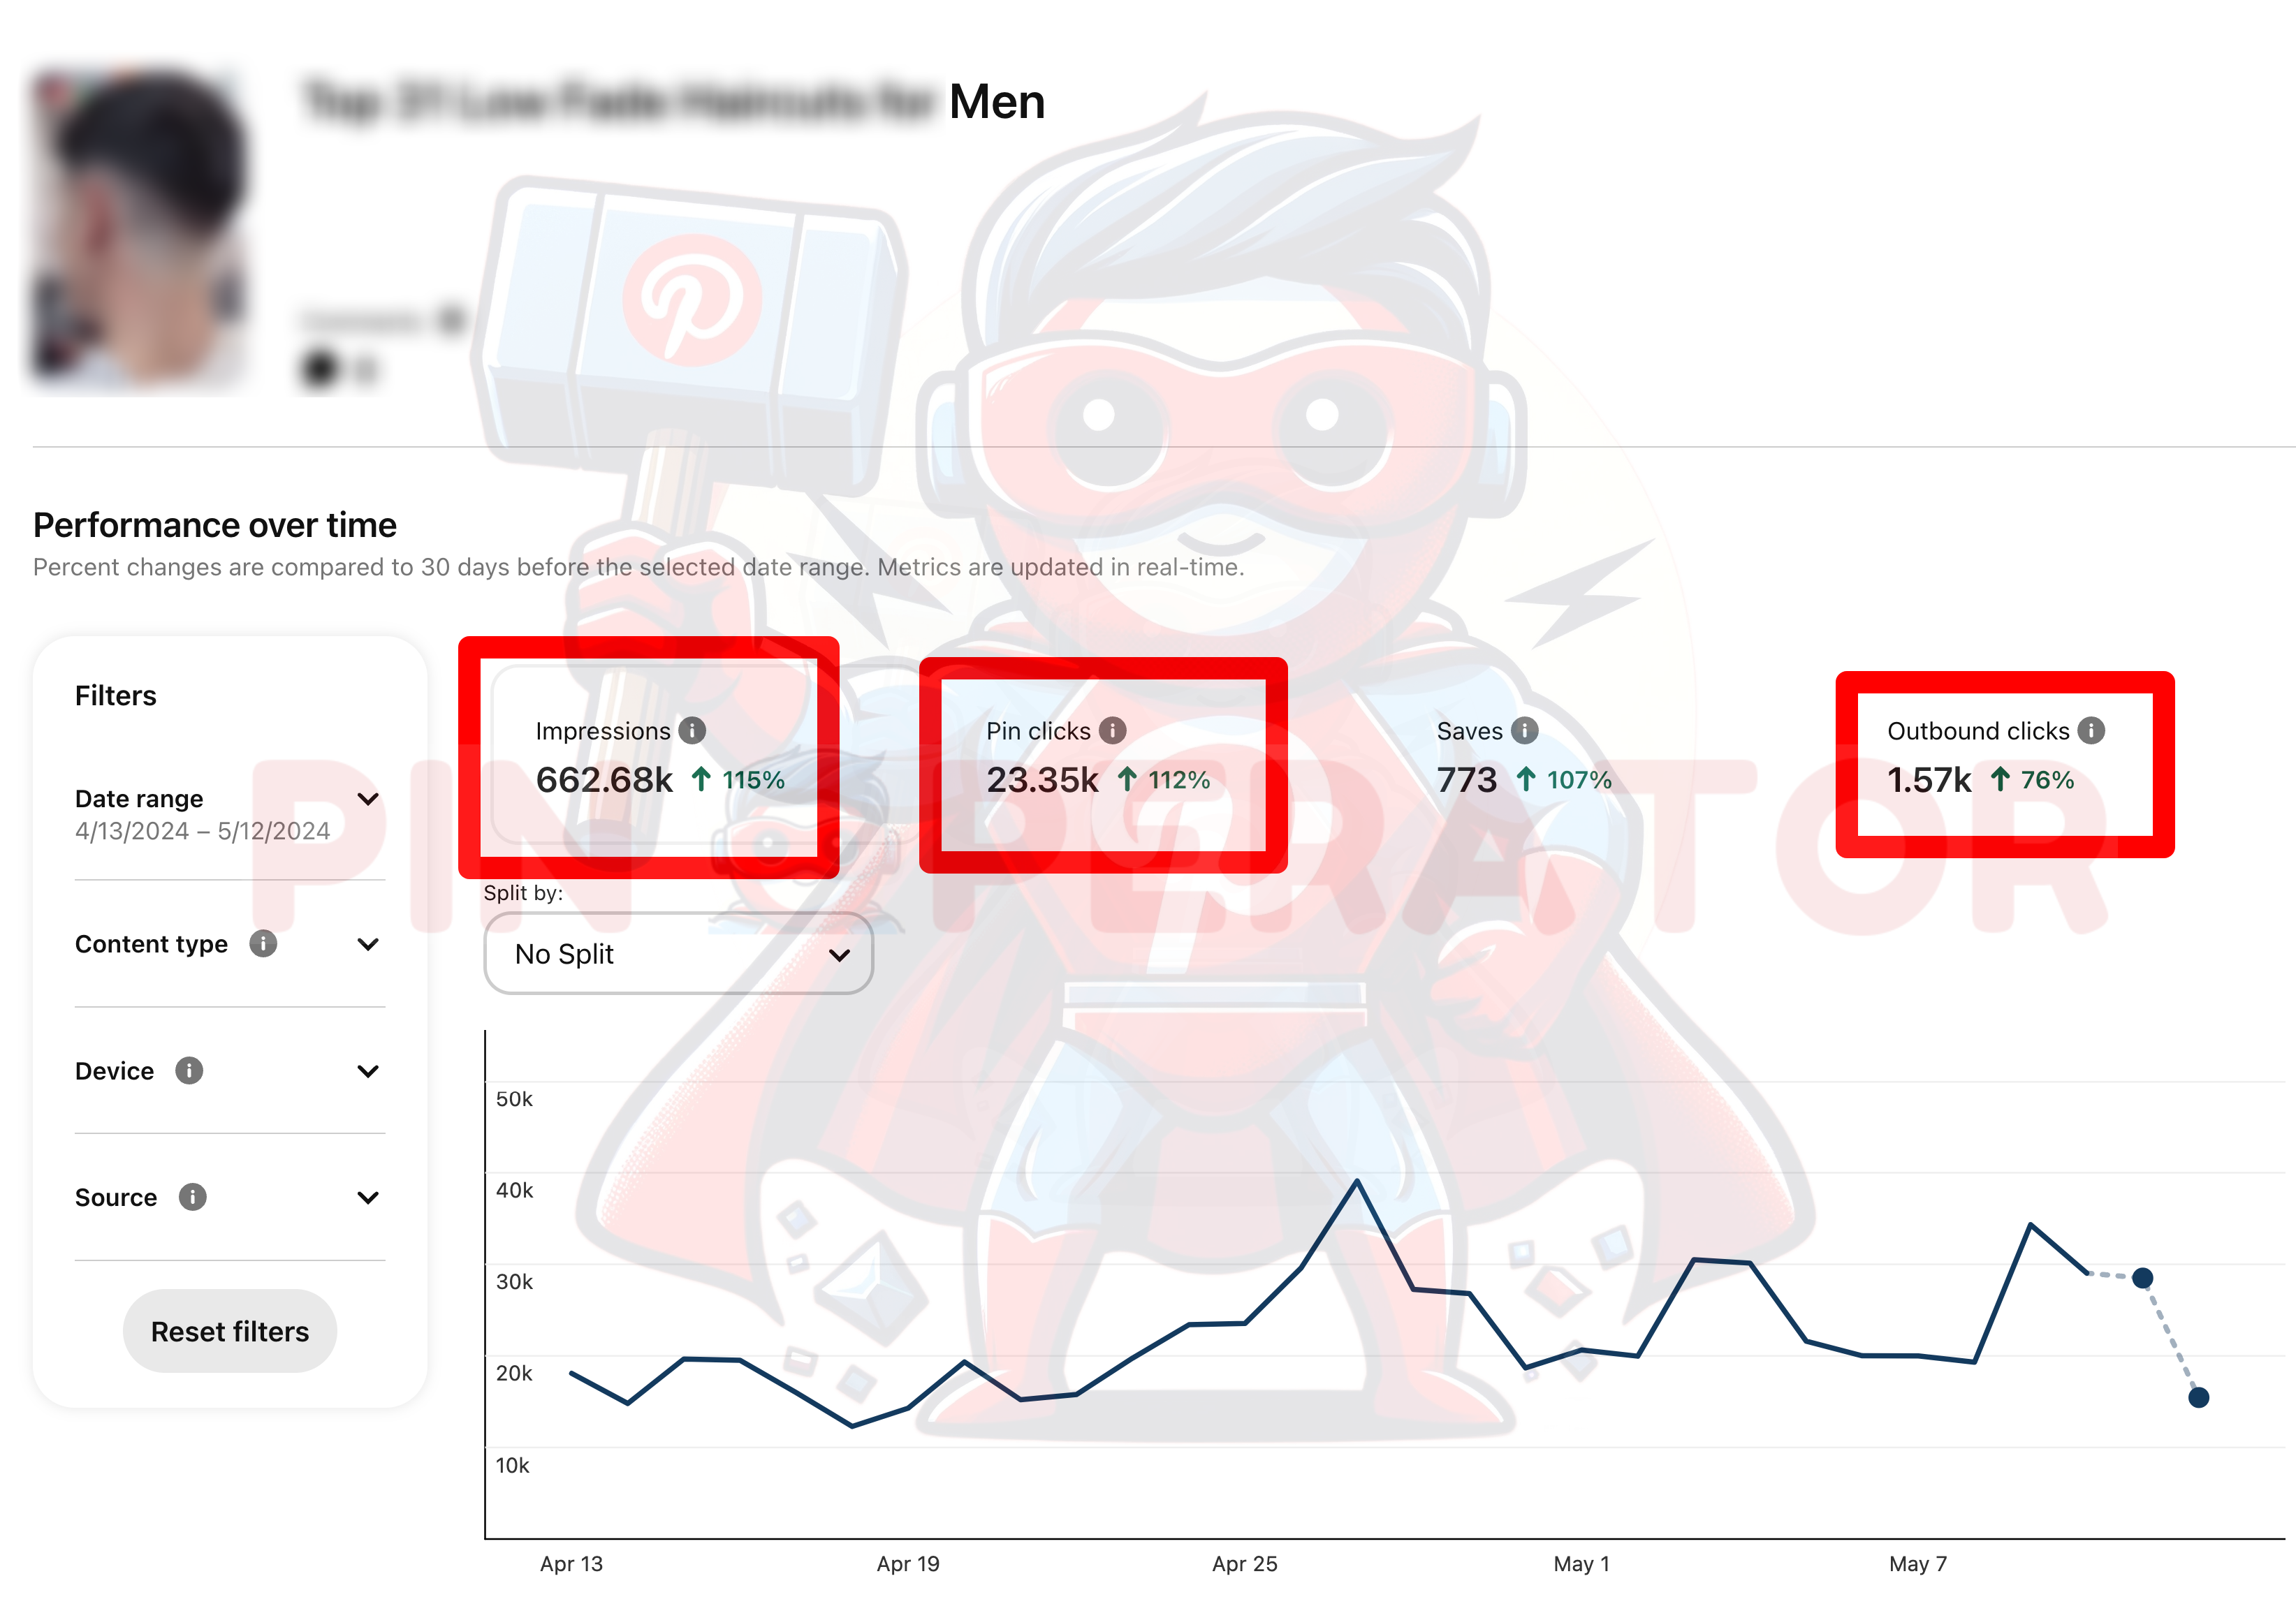
We already described impressions and outbound clicks for overall performance. Here, these metrics are provided for a single pin. So, the formula for calculating the conversion rate for a single pin is the same as the formula used for calculating the CTR across all your pins.
Individual pin metrics include pin clicks instead of engagements, to show the actual number of times that pin was clicked or opened by viewers.
You can calculate your pin click rate using this formula: (Pin Clicks / Impressions) * 100.
Let’s calculate the pin click rate and actual CTR for the men’s fade haircut pin.
Last 30-day metrics,
Impressions = 662.68 * 10^3
Pin clicks = 23.35 * 10^3
Outbound clicks = 1.57 * 10^3
So,
Pin Click Rate = ( 23.35 * 10^3 / 662.68 * 10^3) * 100 = 3.52%
CTR = ( 1.57 * 10^3 / 662.68 *10^3) * 100 = 0.24%
Note: Some experts use the term CTR to describe pin click rates. It makes the conversion rate appear higher, but what really matters is getting people to visit your page or site and there are usually fewer clicks heading out than on the pin itself. Calculating CTR based on how many people click through to your site provides a more accurate measure of actual conversion from Pinterest.
In the next section, we will use these metrics to decide the best pin type, design, title style, etc your growth.
Deciding Your Best Pinning Practices
Once you have collected and analyzed the data from your A/B test, the next step is to make informed decisions that will optimize your Pinterest strategy.
Look at the specific metrics you aimed to improve, such as click-through rates (CTR), saves, engagements, and impressions. Compare these metrics between the two variations (A and B). Identify which specific elements in the winning variation contributed to its success. Was it the image, headline, description, or timing? Understanding this helps you replicate success in future pins.
Consider any external factors that might have influenced the test results, such as seasonal trends, holidays, or concurrent marketing campaigns. Contextual factors can provide additional insights into why a particular variation performed better.
Apply the successful elements to a broader range of pins and monitor the results. Continue testing additional variations to fine-tune your strategy further. Based on the winning elements and insights gained, update your pin designs, descriptions, pinning frequency, etc. accordingly.
Sometimes, initial tests might show a preference for one variation, but ongoing feedback and further testing might reveal new insights. That’s why it is important to be open to feedback and adjust your strategy as needed.
So, A/B testing is an iterative process, and continuous testing will help you stay ahead of trends and audience preferences. Without split testing your pins, you would never grow your account to the best possible outcome. This is why we perform A/B tests on all the accounts we manage, no matter which service packages you take.

